Paul and Brett's Alpha
Pruritus Ani
Back in the Halcyon days of January (what we would give to be whinging today about a NAV that had declined as far as 174p), we made reference to the childish market aphorism about monkeys and picking bottoms, noting that “engaging in such an activity in public is unseemly and likely to cause embarrassment”, but also that “embarrassment can often be quelled with sufficient pecuniary reward”.
We did not foresee the longstanding, even by that point, relative underperformance of SMID healthcare continuing in such a negative manner, but were of course cognisant of the unfolding Russia/Ukraine situation and the broader view that a ‘risk-off’ mindset would be favourable to the relative performance of healthcare.
Quite how the macro scenario has become so conflated with size factor remains something of a mystery to us, but the market can be very short-term in the midst of an existential crisis and this inevitably creates opportunity. One can ignore an itch for so long, but eventually the compulsion to scratch becomes overwhelming.
The ongoing situation with Russia and continued risk of escalation/contagion cannot be overlooked and this is reflected in our decision not to ‘max out’ the gearing currently deployed. However, we thought it worth offering some soothing balm to those who might, like us, feel the broader valuation decoupling has got to the point of being irresistible.
Anusol
The application of symptomatic relief medication without a diagnosis of the underlying pathology is not recommended, so before we consider why now increasingly feels like bottom picking time, we should reflect upon how we got to be in this uncomfortable situation in the first place.
Let us first offer a qualitative explanation: the market sell-off is a culmination of multiple factors: economic and geo-political uncertainty makes future demand harder to predict. Furthermore, rapidly rising inflation also weighs on demand and potentially erodes corporate profit margins as companies need to spend more money to make goods or deliver services. They may not be able to pass all of these higher costs on to consumers in the form of higher prices for those products or services. This is a particular risk when input costs rise very quickly, as they have done in recent months.
Simply put, the combination of these various factors creates a meaningful risk that overall corporate profits will be lower. If this is your expectation, then of course it is understandable and rational that you would want to pay a lower price for a share of those profits than you were previously and so the stock market is falling. It will continue to do so until investors reach a point where they feel confident that share prices imply a level of future profits that is, at a minimum, realistic and probably overly cautious. In that scenario, shares prices could start to rise again as investors put more capital into the market in the expectation of future returns.
Now let us quantify this scenario in mathematical terms. The equity risk premium (ERP) is the incremental investment return an investor should expect over and above so called risk-free assets such as sovereign bonds. The ERP has risen to reflect the uncertainty: if you are taking a bigger risk then you rationally expect a bigger payoff. How much it should rise is the existential question of course, but we can back-solve what is implied by current market valuation and then look at this versus historical precedent to gain some idea of what the ‘bottom’ might look like. The science of picking, if you will.
The ERP is not the only consideration though. As a consequence of the inflationary outlook, central banks are increasing interest rates. The theory is simple enough: if borrowing is more costly, people (and companies) can do less of it and so overall spending power (i.e. demand) in the economy goes down and this reduces inflationary pressure. This is a blunt tool, but the only one governments really have available to try to tame inflation. Its utility is especially limited if the inflation is imported from globally traded goods becoming more expensive due to a war and supply chain interruptions linked to COVID policies in far-away shores versus an excess of consumer demand.
In mathematical terms, rising risk-free rates argue for a further change to the discount rate that one should be applying to future equity earnings. The combination of these two elements (i.e. higher risk-free rates and a higher equity risk premium) explain why it is warranted for earnings multiples to be compressed during an inflationary period that is concurrently marked by significant economic uncertainty. This is the maths of a bear market.
Those stocks that previously attracted a premium valuation for high expected growth are likely to suffer more in this scenario than a lower-rated lower growth stock for two reasons:
- Firstly, the mathematical expression of their higher price-to-earnings (P/E) rating is a lower implied discount rate. In this scenario, a 100bp (i.e. 1%) increase in the risk free rate is a much greater proportional increase in the implied discount rate.
- Secondly, if their growth were consumer oriented and thus in the discretionary bucket there is significant risk that it will be lower in future (cf. Netflix). Thus, investors are now applying a higher discount rate to a lower future cashflow stream and so the share price needs to fall much further to appear attractive once again from a risk-reward perspective.
We have no problem with any of this, so far as it goes. The important question of course is how to know when it has gone too far, because we know the market has a tendency to overreact on any directional change and also tend to apply ‘group think’ that over simplifies the business dynamics of individual companies.
Continuing with Netflix as an example, its recent disappointing results sent the share price down 40% in the immediate aftermath but also pushed the whole US technology complex lower. The latter outcome is not necessarily rational, it is emotional and reactionary. However, it is these sorts of moves that create opportunities for investors to buy into stocks at attractive prices, when the downward move has been overdone and the risk-reward seems attractive once more. In broad terms then, how can we identify the point at which things have objectively gone too far?
Hemosan
Figure 5 below is a data series showing the US 10-year Treasury Bill yield as a risk-free rate proxy and also the equity risk premium implied by the valuation of the S&P500 Index over the past 20 years. We could go back much further, but the nature of the market and the economy becomes so different that historical data becomes almost irrelevant.
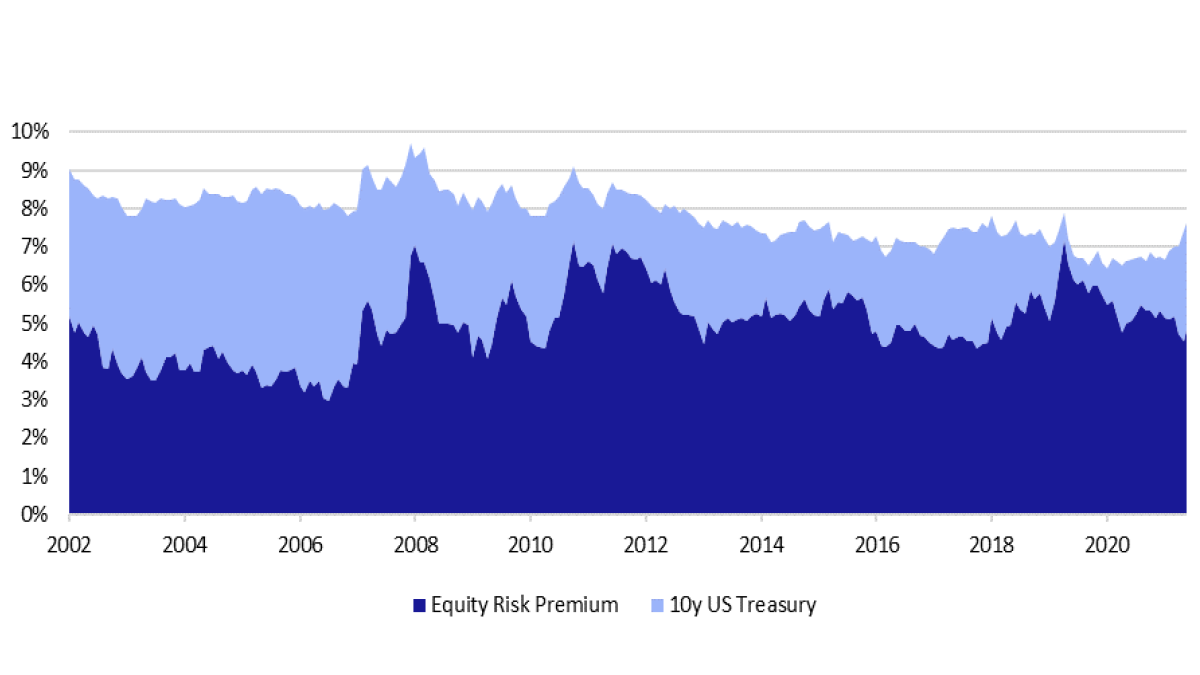
The data suggests a couple of things to us. Firstly, the market seldom trades with an implied discount rate above 9% and, absent a known risk factor that suggests future profit forecasts are wrong, a profitable company trading at an implied discount above 10% is viewed by us as a clear buy signal. Secondly, the ERP seldom rises above 7% (the last time being March 2020 and prior to that, 2012).
Over the past 20 years, the average ERP has been 494bp and the average yield on the 10-year has been 292bp. If we take the time series back so it is closer to 40 years, then the average for the ERP is ~430bp and the 10-year yield ~490bp. When we think about the broad market there is scant evidence for the application of a discount rate >10%when considering the fair value for the long-term earnings of an equity security in the United States.
The pessimist might well counter with the observations that, whilst such academical affirmations are well and good, the ERP is not currently at 7%, the implied discount rate is still well below 10% and US rates are set to rise further in the coming months. This is true; the overall market could fall further. However, we are not in the business of buying market futures or ETFs, we are in the business of buying individual companies on a multi-year investment horizon. Let us consider these two points (implied discount rates and interest rates) in more specific detail.
E45
The mechanics of the US interest rate system is that the bank targets a range for the Federal Funds Rate (the amount the central bank pays in interest for the regulatory capital that banks must keep on deposit with the Federal Reserve) and the yield on the 10-year bond, which any investor can buy, reflects the market’s current expectation of how that central rate will evolve over the coming years.
The best way to track this via the spread between the two rates (Fed Funds and rolling 10-year yields; this is known as the constant maturity index). Over a 5-year period, the spread has averaged ~100bp. Intuitively, when the spread rises above the average, it is a signal that rates are expected to continue to increase and when it falls back toward it, that the interest rate outlook is stable. If it goes well below, that indicates an expectation the Federal Fund rate is set to decline. We illustrate the spread over the last five years in Figure 6 below.
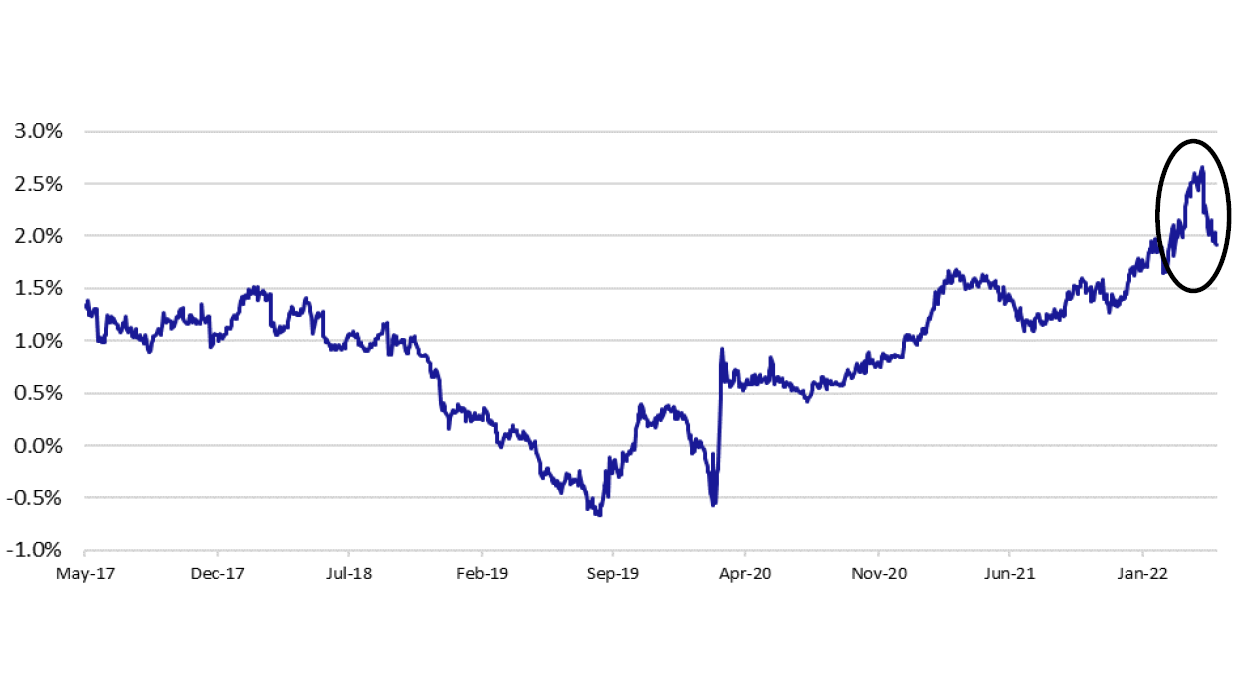
Having explained the data previously, it is worth highlighting what happened in March 2020. The market expected rates to be cut as the pandemic began to unfold and indeed this was the case; two cuts totalling 150bp in March 2020 took the Fed rate to zero and engaged in an unprecedented bout of quantitative easing, which distorted the picture, so it is probably best to ignore that short period.
Interesting as that may be, the more important point is surely what the most recent movement in the spread is telling you as a forward indicator of peak interest rates: it’s not rising anymore. This does not mean that there will not be further interest rate rises, but it does suggest that the market is less fearful that rates will need to rise further than current expectations, which are for the rate to peak in 2023 somewhere around 3.5%.
Preparation H
When considering the ERP and the relation to the risk free rate, we have made reference to data for the S&P500. Of course it would be better to have a comparable dataset for a healthcare index, but this is not as straightforward as we would like it to be and we cannot provide one, so a broad market index will have to do. Since our investment portfolio has consistently been >90% US equities, this index feels the most appropriate market proxy for our particular strategy.
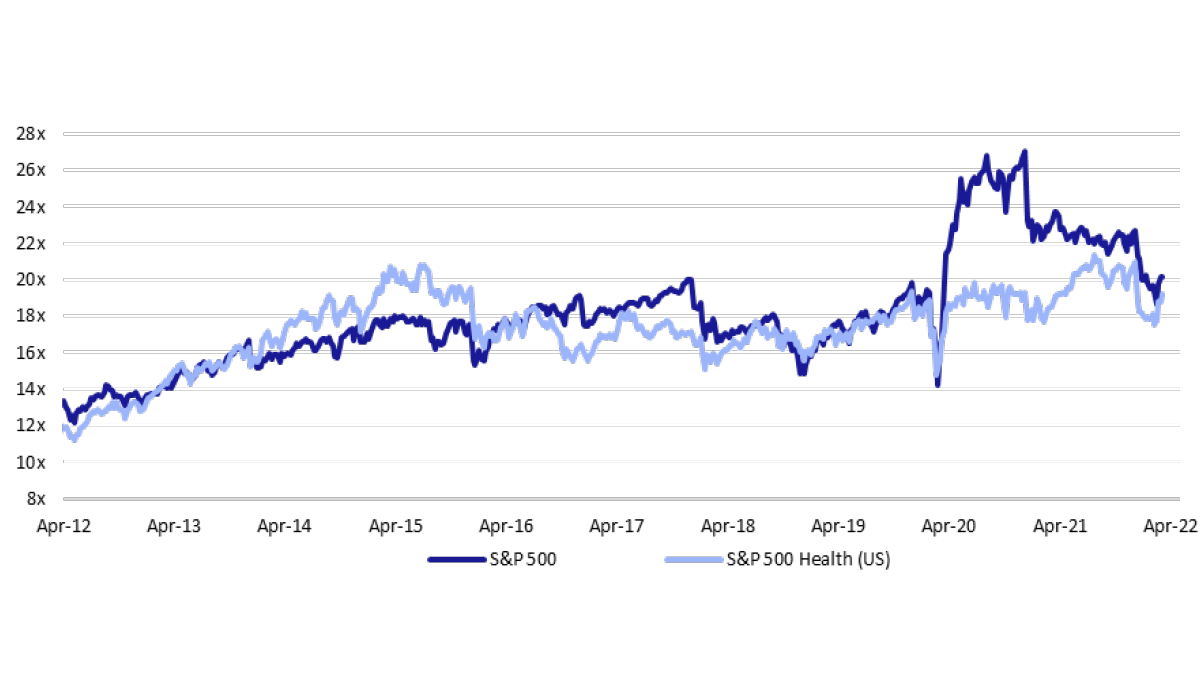
In support of its relevance, we would note that the valuation correlation of the S&P500 to the S&P500 Healthcare sub-index is very good, as illustrated in Figure 7 below, save for that weird period in the early phase of COVID where valuations for technology stocks went stratospheric and distorted the S&P500 for a year or more. If the forward P/E’s are similar and correlated then it is reasonable to conclude that their ERPs and their evolution are likewise similar and correlated.
It is fair to point out that some healthcare companies, especially those in the drug development arena carry a level of risk regarding future cashflows that is different to the wider market. There are not many industries where you can sink billions into a single product development project over the best part of a decade to then have a regulator say “no”. Perhaps the aerospace sector is similar (think of Boeing’s travails with the 737-Max or Airbus’ A380 jalopy).
How does one account for this structurally higher level of systematic risk for these companies versus other industries? In reality, the answer for the generalist investor is that they do not have to; it has already been taken care of. The underlying analyst projections that make up the consensus forward revenue and earnings picture are normally probability adjusted.
Simply put, if the analyst believes that a product would ultimately go on to reach sales of $500m in five years’ time, but there is only a 60%chance of it being approved based on currently available clinical data or potential competitive obsolescence, the FY5 forecast will be$500*60% = $300m. This is why you often see the valuations of Biotechnology companies jump up when they report incremental clinical data or progress; the market is reducing the magnitude of the probability adjustment, which argues for a higher net present value for the shares.
Germaloid
The previous sections were intended to lay out our thinking as to why one can objectively consider equities discounting future earnings at a rate above 10% as being very cheap in any reasonable historical context and, if one is applying this to the healthcare sector, those future earnings projections should include appropriate probability adjustments for products that have yet to achieve regulatory approval in key markets. Let us now consider the current BBH portfolio in these terms.
When we are looking at potential investments, we utilise a number of different metrics but in particular we use discounted cashflow analyses, reverse DCF (i.e. what does the current share price imply) and FY5 normalised earnings. We would also look at these parameters across a number of different scenarios and levels of probability adjustment.
We are currently using a range of discount rates from 7.0-9.0%, with a weighted average of 8.0%. Our terminal growth rates (usually covering the period >2035) range from -5.0% to 3.5%, with a weighted average of 1.6%, which is well below the historical level of inflation and thus very cautious. We look for a teens or better IRR from these investments over the holding period (which is assumed to be at least 3 years, usually 5+).
For the curious, the -5.0% is applied to a Focused Therapeutics company where our model includes all of their existing drugs out to patent expiration and, since they do reformulation rather than research, we assume no additional products come into their portfolio in our base case model, hence the cashflows decline post patent expirations.
Now for the reverse DCF analysis. If we keep the scenarios the same and the discount rates the same, what terminal growth rate do we need to apply to each stock for the models to return the current share price as the ‘right’ answer. The range goes from -110% (!) to +2.5%, with a weighted average of -8.8%. Nothing has happened in the last nine months that should prompt anyone to take a different view on the structural growth opportunity of the healthcare market, especially not one where the implication is that less money is spent in the future!
The more relatable analysis is to keep our terminal growth rate assumptions the same as our base case and look at the implied discount rate needed to yield the current share price. Here we would need to apply a range of rates from 7.0% to 20.6%, with a weighted average of 11.5% – well above the 10% highlighted previously (with interest rates where they are currently, a 10% discount rate implies an ERP >7%). Indeed, six of the 29 stocks in the portfolio require a discount rate >14% to generate the current share price, 14 require a rate >10.0%and 22 require a rate >9.0%.
As we noted previously, it is rare that the wider market discounted such a scenario and never for a protracted period of time.
Finally, it bears repeating that we see no macro-economic or regulatory reason to have a less positive view on the dynamics of the global healthcare market today than we had six or twelve months ago. Our companies operate in an environment where demand is largely inelastic and is set to continue to rise due to the twin demographic drivers of a rising and concurrently ageing global population, allied to the expansion of the available treatment options through continued progress in biomedical research and product development.
Because demand is inelastic, they have considerable pricing power to pass on rising costs and generally already have high gross margins so non-labour input costs are only a small driver of the resultant operating margin. Again, we see no reason why these longstanding ‘defensive’ attributes of healthcare have changed in the recent past or why they are likely to change in the future. If you are worried about consumption patterns and inflation or stagflation then we believe that you cannot do much better than to own healthcare assets.
Finally, there is no reason why one should think these attributes are stronger for large companies than small ones. The only difference is that a broader product portfolio gives you lower systematic product-specific volatility in sales and earnings. Healthcare is healthcare at the end of the day.
Forget the creams and pick away!
Hindsight is the worst form of wisdom, since we cannot do very much about the past. As a consequence, we must accept that we are where we are in terms of our relative and absolute performance since H2 2021. We noted last month how we regularly review the portfolio from the perspective of a clean sheet of paper. We reiterate again that, looking forward on any objective measure, this is a collection of very cheap, high quality growth assets and hope that the previous analyses offer some additional colour as to why we are so convinced this is the case.
Russia’s war against Ukraine and the lack of any obvious strategic objective that could enable an early resolution of it clearly complicates any long-term analysis of the broader economic and geo-political outlook. China’s zero-COVID nonsense is a further cloud on the economic outlook and again is one where an early resolution (i.e. capitulation) seems fanciful.
We are not so blinkered as to not recognise the risk that markets could yet fall further and that not everyone has the appetite to take on more short-term risk because the longer-term opportunity seems so incredibly compelling. We do though, and your managers have again added to their overall personal holdings in the Trust during May.
We always appreciate the opportunity to interact with our investors directly and you can submit questions regarding the Trust at any time via:
shareholder_questions@bellevuehealthcaretrust.com
As ever, we will endeavour to respond in a timely fashion and we thank you for your continued support during these volatile months.
Paul Major and Brett Darke