Paul and Brett's Alpha
A short story – in pictures
As noted previously, it’s the holiday season and you probably don’t want a long article on any topic, so here is some historical data around relative healthcare performance.
As a reminder, the Bellevue Healthcare Trust seeks to invest into companies at the forefront of changing the healthcare delivery paradigm in order to improve clinical outcomes, cost effectiveness and caregiver choice. We have identified a series of themes around this evolving patient experience and, wherever possible, we seek to maximise the operational gearing of the investee company into these themes.
Healthcare innovation is expensive, time-consuming and generally considered to be high risk. The lamentable R&D productivity of ‘big pharma’, which stands well below the cost of capital attests to this grim reality. In the very early stages, nascent companies are dependent on significant venture capital funding and for various cultural and historical reasons, this has tended to come from the US (we estimate around 90% of healthcare VC money is controlled by US entities). A direct consequence of this is a tendency for these companies to list in the US.
All other factors being equal then, an innovation-centric approach to healthcare investing is going to lead you to a portfolio that is biased to small and mid-cap US companies and these are the very same emergent properties of our strategy.
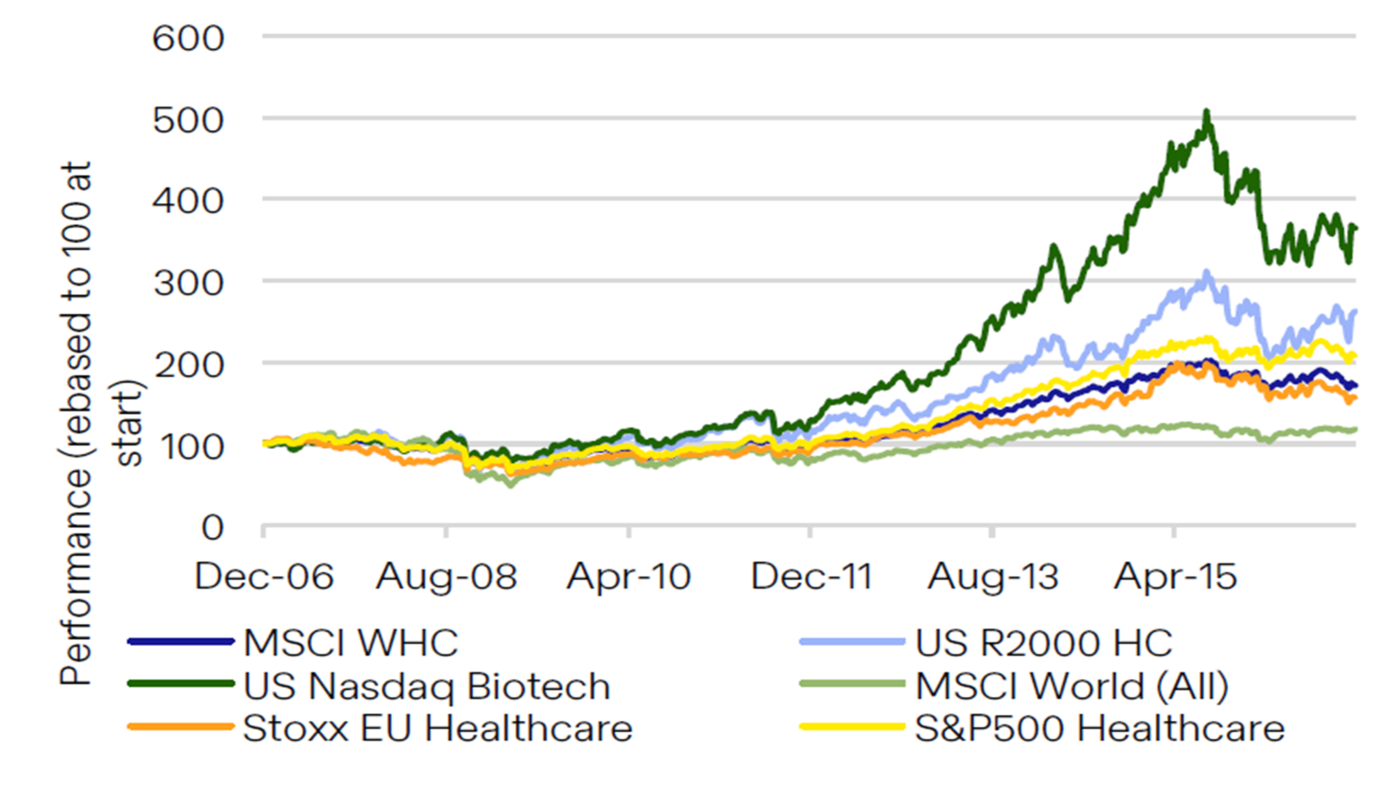
The first chart we are going to show you attests to the benefits of such an approach. It covers the 10 years preceding the launch of the Trust (i.e. 1 December 2006 to 1 December 2016) and includes six indices:
1. The MSCI World Healthcare Index: the c150 largest healthcare companies across the globe (ex. China).
2. The US Russell 2000 Healthcare Index: effectively an ‘all-comers’ index of listed US healthcare stocks with >400 companies.
3. The US Nasdaq Biotech Index: this is not solely a “biotech company” index and includes various non-US pharma and Tools companies (e.g. AstraZeneca, Sanofi, Illumina). However, it is heavily weighted to innovative therapeutics, and has >250 members)
4. The MSCI World Index: the c1600 largest companies across the globe (ex. China), covering 25 industry sector groups.
5. The Stoxx 600 Healthcare Index: this covers the 55 largest healthcare companies in Europe (and includes the UK and Switzerland).
6. The S&P500 Healthcare Index. this includes the 66 healthcare sector companies from within the S&P500 Index of the largest companies in the US.
This selection of leading indices enables us to make some comments around the geographic, sub-sector and market capitalisation characteristics of historical returns.
We would make the following observations: healthcare innovation, especially smaller-cap innovation in the US (as evidenced by the Nasdaq Biotech and Russel 2000 HC series) delivered significantly better returns than investing into broader US, European or Global healthcare and the broader equity market.
Delivering robust performance may seem simple, but of course this is a very high-level view. It does not take account of volatility for these index series and expected returns should be commensurate with risk and there is more risk lower down the liquidity and company maturity curve.
The reality of both indices is that a small number of constituent companies drove the vast majority of returns (this is currently true for the stock market as a whole, as we have noted in previous missives. However, this narrow leadership within broad indices is very unusual in a historical context).
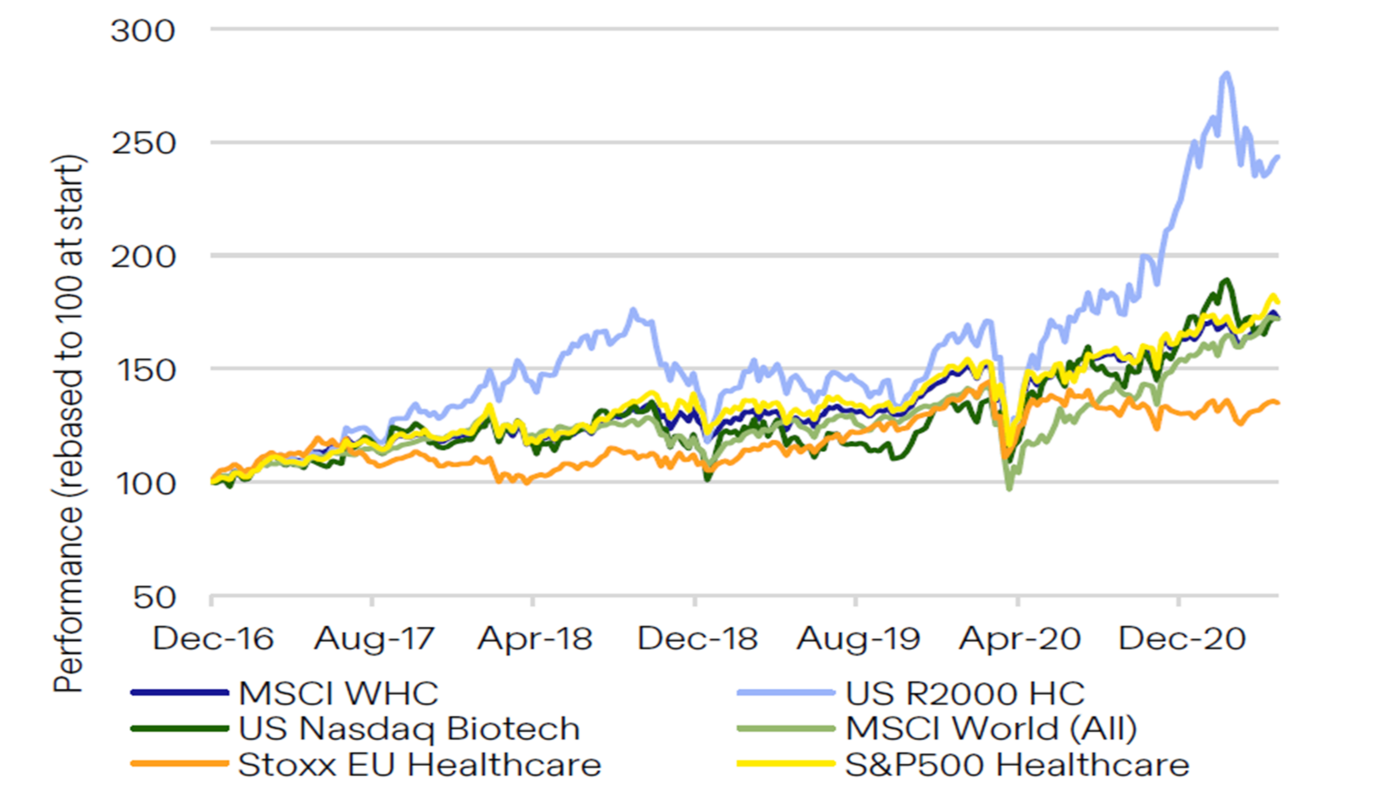
Our second chart covers the period from the launch of the Trust to early in Q2 2021, when the broader macro picture began to change. Here again, we see that mid-cap US healthcare performed strongly but the wider picture is less clear. The US outperformed Europe, but healthcare did not do much better than the market and biotechnology did not outperform wider healthcare.
Next we come to the period from Q2 2021 to the end of 2022. This has been one of the most fundamentally challenging periods that we can remember in our 25+ years; one characterised by all manner of complex macro dynamics that have overshadowed company fundamentals.
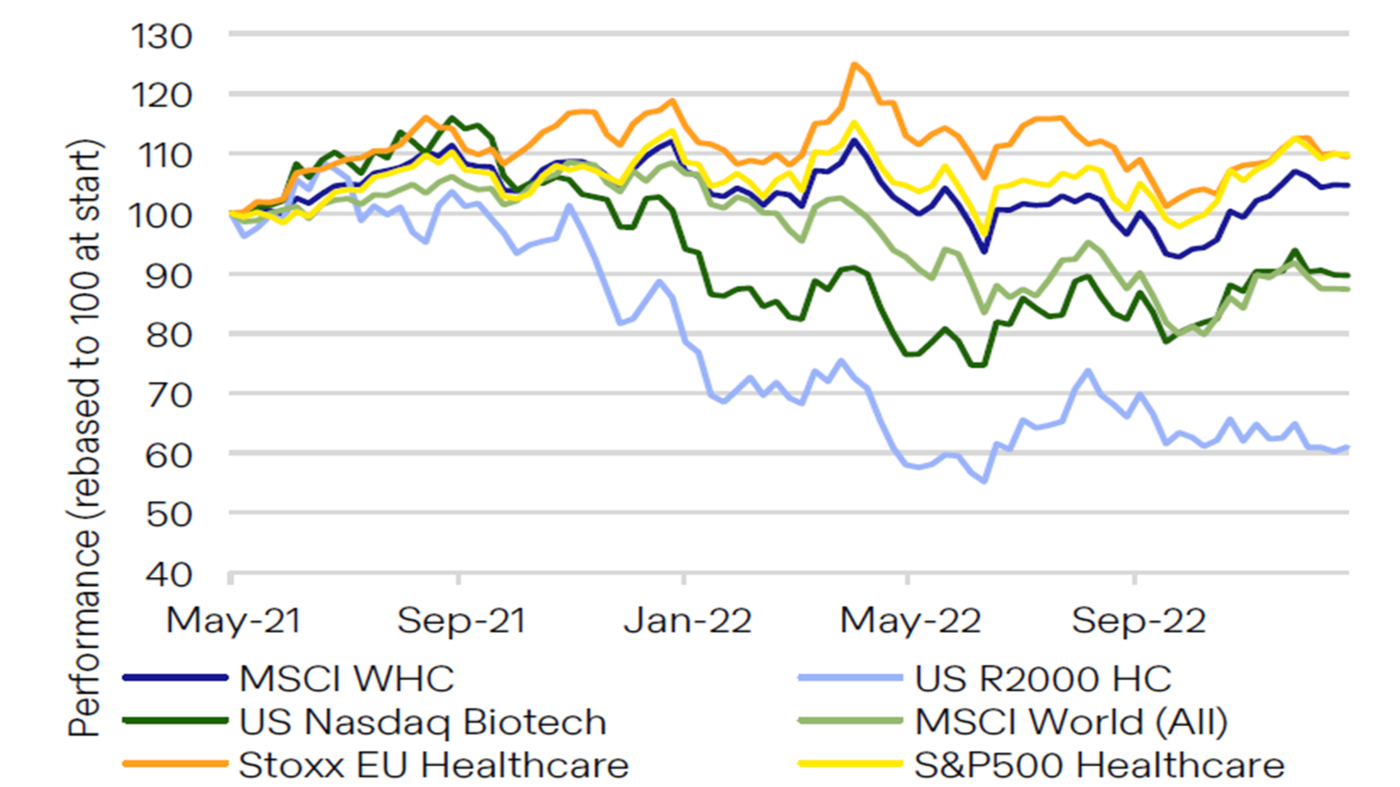
Healthcare broadly outperformed the market but ‘size factor’ and ‘asset duration’ (a relative devaluation of companies where positive cashflows are further out in the future) came into play. As a consequence, SMID healthcare has been one of the worst places to have exposure. Again, this is a general comment and of course some companies have fared well in this period.
Even in a macro-driven environment, stock picking is important. For example, over the period in Figure 7, the US dollar NAV return of the Trust was 20% higher than that of the Russell 2000 HC Index (but below that of the Nasdaq Biotech Index).
Broadly speaking though, the relative valuation changes implied by the under-performance of SMID companies compared to their larger capitalisation brethren is beyond anything that can be logically explained by interest rate increases. What drove this? We think the simple answer is risk aversion. To the extent that one wanted to continue to hold equity exposure, the preference was for large, liquid companies that are easy to sell and unlikely to experience financing issues in a world of tightening/more expensive borrowing.
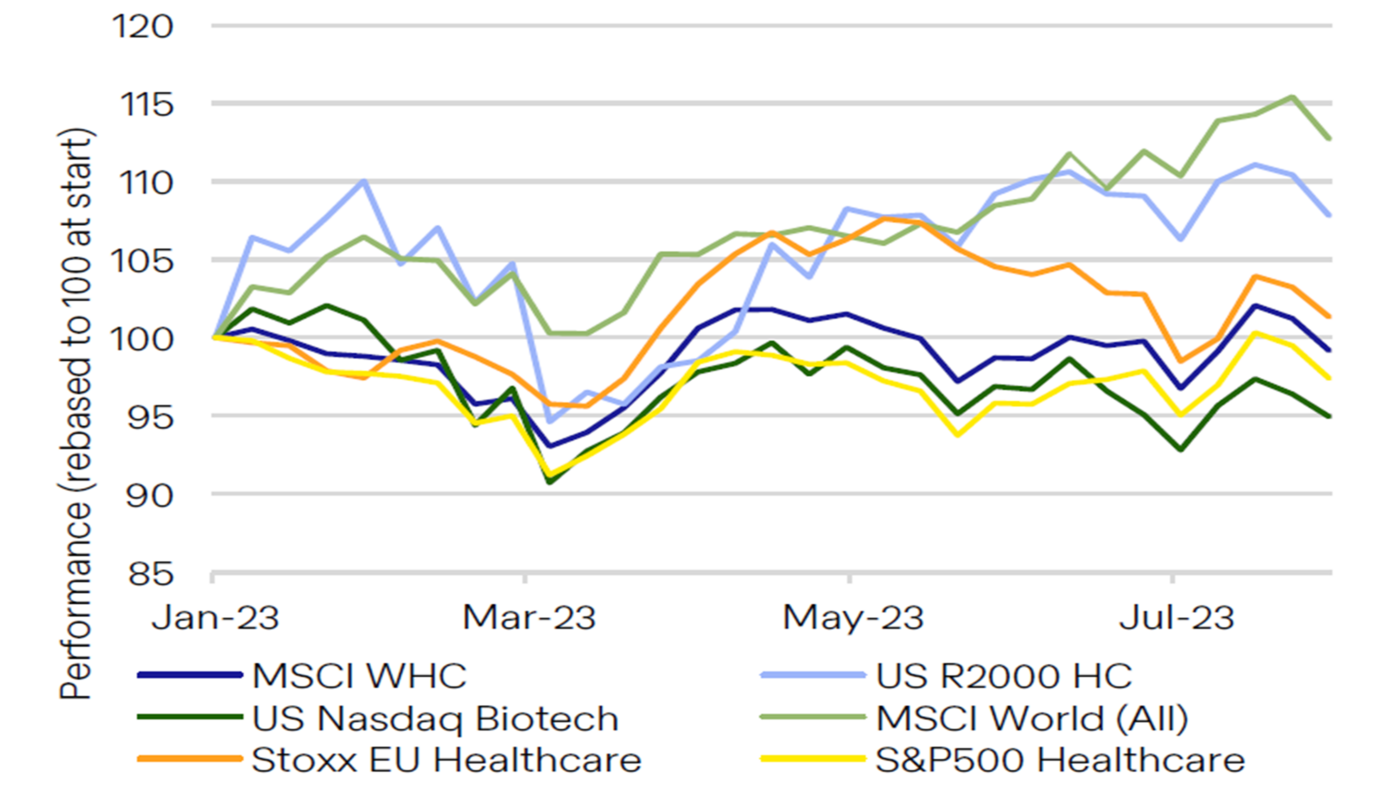
Finally we come to 2023. As noted previously (ad nauseum), we have faced a very challenging overall dynamic for healthcare, with material underperformance of the wider market, albeit a market led by a very narrow cadre of mega-cap tech companies. Biotech has continued to struggle to break out of its malaise but broader mid-cap healthcare has recovered some ground and has been the best performing area.
With healthcare still lagging materially and biotech yet to re-assert its place in the normal order of things, we think that the performance reflected in the Russell 2000 series represents something of a catch-up. As noted previously, these stocks were over-sold well beyond anything imputed by rising rates. The Trust has benefitted from this to some extent in recent months, but there is still a lot of value on the table in our minds.
We think this is a story with a happy ending. The market is beginning to see the inherent value in the types of companies that the Trust is invested in and, in the fullness of time, we see no reason why the dynamics illustrated in Figures 5 and 6 will reassert themselves. The Trust’s track record during that period, in terms of its absolute return and the Sharpe ratio was very favourable and we see no reason why that will not be the case again.
We are not ready to ‘ring the bell’ and argue that we are in the foothills of a bull market, but we are grateful to see the beginnings of a re-orientation toward the rewarding of positive fundamentals.
It has been a very long two years and we all deserve a break. We hope you and your loved ones find time for one in the weeks ahead and it brings your own Goldilocks’ scenario: not too hot, not too cold and free of bears (and rain!).
We always appreciate the opportunity to interact with our investors directly and you can submit questions regarding the Trust at any time via: shareholder_questions@bellevuehealthcaretrust.com
As ever, we will endeavour to respond in a timely fashion and we thank you for your continued support during these volatile months.
Paul Major and Brett Darke