Paul and Brett's Alpha
“Events dear boy, events”
What a year 2022 has been. We are all exhausted after almost three years of being buffeted by external events that were previously unimagined by all but the most lugubrious of minds. Worse, this calamitous concatenation of geo-politics and supply side shocks is far from over, especially here in the UK.
It is not surprising that investors and thus markets have become hypersensitive, over-reacting to perceived positive and negative news; this febrile tendency is unlikely to change in the near-term. With this in mind, and thinking ahead to the remainder of the year, how does one plot a course through such a febrile morass? The starting point must be to think about equities broadly as an asset class and compile a list of what we currently know:
- The economic outlook will continue to worsen, owing to an invidious combination of COVID, China, Russia/Ukraine, ongoing supply side shortages and unhelpfully volatile weather patterns (with the attendant impact on soft commodities).
- A deteriorating economic outlook for Europe, the US and China is a consensus view, although the pace of decline in various regions remains much debated, with the US looking in the best shape by far and the UK looking very weak.
- For now at least, central bankers will continue to deploy the blunt instrument of fiscal tightening, which will exacerbate the negative outlook and do little to address the structural supply-side shocks impacting energy expenditures and raw material/supply chain costs. These are arising from external geo-political events.
- Whilst energy price increases are self-limiting in the sense that users will cut back, it seems unlikely these challenges will resolve in the next year and thus more Western countries are likely to adopt energy price capping policies like those in France (the bouclier tarifaire, which was actually put in place as a COVID impact measure, pre-dating Russia’s war against Ukraine. It was bolstered and extended because Macron wanted to win the election). How such measures will be paid for could, in and of itself, have significant economic ramifications for those countries.
“Too many people live too much in the past”
There is nothing insightful or new in the list above and some might say one should be able to conclude that all of these things are already in the price (if one believes in the efficient market hypothesis). In dollar terms, the MSCI World Index has declined 19% year-to-date, but is almost 6% above the lows seen in June 2022 (but also nearly 8% below the recent August highs). Does this mean we have tested the lows and now it’s a sideways-to-upward grind from here?
Things are rarely so clear cut. As the mini-rally through to mid-August and post-Jackson Hole sell-off, amply demonstrates, the market has a tendency to oscillate around a medium trend-line; the more uncertain the trend direction, the more volatile it tends to be. “Value”, for want of a better word, only becomes apparent over a longer time period.
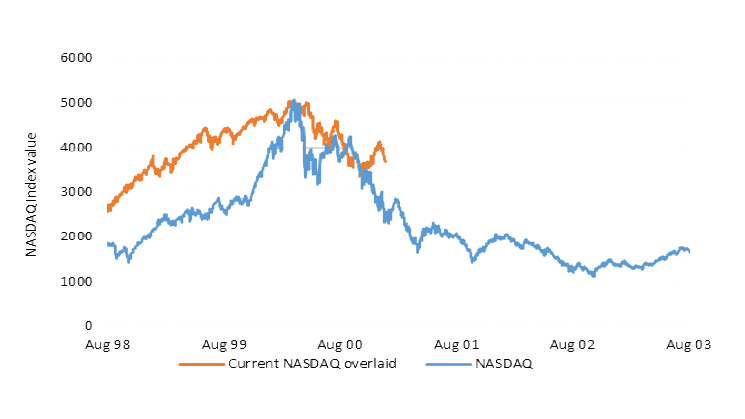
Sometimes, those periods can be very long and the road a challenging one to traverse. We are old enough to remember the “Tech Crash” of March 2000. It was then a further 15 years before the NASDAQ surpassed its 2000 high. More importantly, the ultimate low did not come until eighteen months after the initial sell-off. There were plenty of mini-rallies on the way there, but the top-down view suggests it was hard to make money from growth stocks in the early 2000s.
Figure 6 illustrates the period running into the 2000 crash and the subsequent path to its low point and we have overlaid the most recent data for the same index such that the most recent high (in November 2021) so that it lines up with the March 2000 peak and the various twists and turns in the meantime.

We are not including this chart to try and convince anyone that the market is going to fall a further 50% from here as it did in 2000, because that is not our expectation. Nor are we trying to persuade you to sell everything and stay out of the market. This is not 2000; the world has moved on and there was undoubtedly a bubble in the valuations of certain types of technology stocks around the turn of the century. Indeed, analysts had to invent preposterous new ways to try to justify those lofty valuations such as ‘EV/click-through’ or ‘EV/eyeball’. Heady days indeed.
Our point is more that markets can be unpredictable over short periods. Whilst one could tritely state that anyone buying the first dip in March 2000 was clearly wrong, that depends on what you bought and how long you held it for. The market rallied back 50% before it fell sharply again from September 2000. That’s an annualised return of 100% in the meantime. Some people performed very well buying tech stocks during this period.
How does this all relate to H2 2022? We cannot know for sure what future twists and turns await us on the geo-political or weather front. Both Xi and Putin have near absolute power and at least one of them seems to be insane; neither seem apt to listen to advice or to admit when something is wrong and should be reversed.
Neither agree with the Western liberal consensus that has dominated world affairs since Roosevelt paved the way for the creation of the United Nations. The world is always in some sort of transition, but this one involves a lot more moving parts than usual. When considering how to navigate through it, we reiterate that all one has to rely on is their analytical work and judgement. What does that work suggest?
“To be alive at all involves some risk”
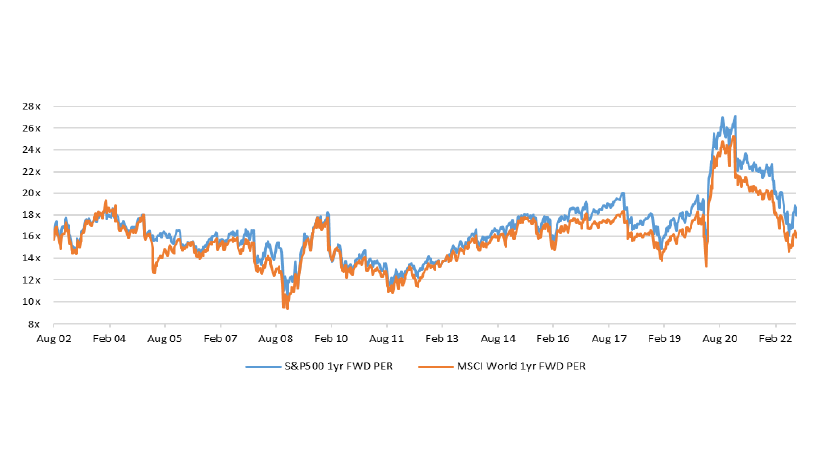
Firstly, it does not suggest the market is very expensive, as was the case in March 2000, and as could have been argued to be the case in late 2020. Figure 7 illustrates the current forward PE Ratios for the US S&P 500 and Global MSCI World Indices:

One of the challenges of using Index-level data for any value analysis is that the nature of the market constituents evolves. There is a lot more technology involved in corporate profit generation these days, and it’s margins and capital intensity are very different to that of physical machinery or human resources.
Whilst corporate margins may be at post-war highs, how relevant is the past margin data to the current situation; perhaps the higher margins are simply an inevitable consequence of technological productivity improvement and thus represent long-term structural change?
We have sought to address this in Figure 8, which expresses August 2022’s month-end PE Ratio as a percentage of the average and the low point over five, ten and twenty year periods. Compared to recent history (5-year averages), the valuation levels appear attractive. It could test new lows once more, suggesting a fall of a further 30% but, on the other hand, a return to merely an average rating suggests double-digit upside from here. Whilst the market has been cheaper in the recent past, it has not been much cheaper.
| S&P 500 | MSCI World | |
| 20 yr Avg | 107.2% | 100.2% |
| 10 yr Avg | 98.2% | 92.9% |
| 5 yr Avg | 90.2% | 87.2% |
| Min 5yr | 126.3% | 119.8% |
| Min 10yr | 137.0% | 123.4% |
| Min 20yr | 169.3% | 170.3% |
To our minds, the bigger question for investors is not so much the question of further compression in the P/E ratio as much as having confidence in the “E” component. Energy and supply chain costs have risen for businesses and consumers. Employees are demanding wage increases to pay for higher food and energy costs. Corporates are investing into supply chain resilience and redundancy to overcome manufacturing bottlenecks, crimping future margin evolution and swelling working capital.
At best then, consumer discretionary spending power stays at the same level and corporate profits (ex. Energy extractors or producers) fall as consumer spending does not grow and the costs of providing what goods and services they do wish to purchase end up rising. At worst, revenues and margins both decline.
If governments do intercede to cushion the energy impact, the monies for funding energy subsidies must come from somewhere, probably via taxation. Will the blow fall more on corporates than hard pressed voters? We will leave readers to decide for themselves, but companies don’t vote and are making “record” profits, so this feels like the soft underbelly to us.
Higher taxes of course mean lower profits and a further lowering of the “E”. In all probability then, “E” is not going to grow at a similar pace in the coming years, and this is what consensus forecasts assume, at least for 2023, as reflected in below-trend growth for both the S&P500 and the MSCI World Index.
“I read a great number of press reports and find comfort in the fact that they are nearly always conflicting.”
All of the above is nebulous opinion; one will find bulls and bears in equal measure across the spectrum of commentators and some within that who think the current moment is either the opportunity of a lifetime or that we stand on the precipice of a market calamity. At least 50% of these people are wrong, as always.
The fortunate thing about being a healthcare investor is that the demand picture is de-coupled from the economic cycle. It is true there has been a long-standing correlation between the proportion of people well insured in the US and growth in the world’s most important marketplace. Many of those people receive their care via a commercial plan provided by their employer. Ergo, unemployment risk does impact healthcare sentiment, albeit in a lagging fashion.
However, this correlation now looks rather weak to us. Most of the growth in US healthcare utilisation is coming from the over-65s and the vast majority of their care is paid for by the Government through Medicare.
Background utilisation trends are still on a recovery trend from COVID-19, which disrupted routine medical care for many at risk groups. We have a lot of catching up to do in terms of diagnosing chronic illnesses via routine examinations. Waiting lists need to be cleared (or an attempt must be made if you are in the UK).
In the longer-term, the sedentary and asocial aspects of the pandemic lockdown response have increased morbidity rates across all manner of conditions, both physical and mental and it is increasingly clear that working from home is for many a double-edged sword of less movement, worse posture and easy snacking. These unfortunate developments represent a future long-term tailwind.
Healthcare innovation continues apace and this will further drive demand. Cost mitigation is necessary. However, this remains an investment opportunity in and of itself and we are very pleased with the returns we have made from our holdings in the ‘value-based care’ marketplace, which is finally gaining momentum.
There are undoubtedly a great many things for investors to fret about, but the background utilisation trend for healthcare continues to point to the sunny uplands and neither a pandemic, recessions, geo-political tensions or an energy crisis are going to change that long-term growth trend.
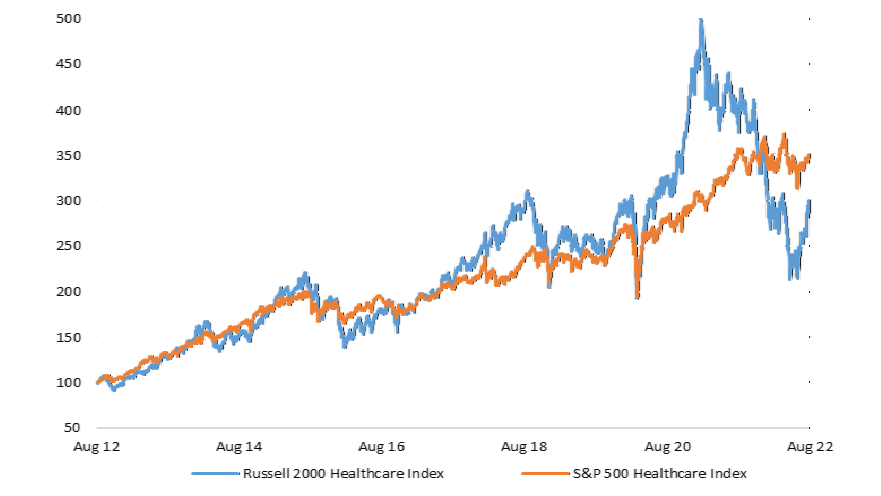
Within healthcare, whilst the past few months have seen some degree of catch-up for SMID healthcare versus larger-cap, there is still significant potential for further relative re-rating.

“History is apt to judge harshly those who sacrifice tomorrow for today”
What does all this mean for us practically? We are ultimately here to take calculated risks on your behalf; that is what investing means. However, one cannot ignore the short-term realities and their consequences: volatility will remain elevated and market liquidity may ebb and flow more than usual.
We remain confident in the outlook for our holdings on four frontsa: i) our longer-term forecasts (the “E”) are underpinned by positive non-cyclical external drivers of one sort or another. ii) we use a teens hurdle rate for returns and thus are confident that the portfolio will deliver satisfactory returns over the longer-term, even with some slippage around the “E”. iii) the P/E to growth metrics that our stocks currently trade on is not elevated relative to historical norms for the sub-sectors in which they operate, suggesting valuations should be under-pinned to some degree. iv) per Figure 9, SMID healthcare remains attractive on an intra-sector relative basis.
Our approach is inherently uncorrelated with the Mega-Cap dominated indices commonly used to benchmark performance in our sector, so there will be periods of dispersion. These can be positive (June-August) and negative (April to May). We therefore urge you to look at returns over the longer-term.
If you compare BBH’s total return since inception to one of these benchmarks or to our peers, then hopefully your concerns (if you have any) will be somwehat assuaged. Following our recent de-leveraging, we have significant borrowing capacity available and we will continue to deploy capital opportunistically to enhance returns, looking to add to positions during any further periods of weakness. If the market does show some stability, we will remain aligned with our mid-single digit longer-term leverage target.
The coming months will be hard work, just as H1 2022 has been. In the end though, we expect to look back at these markets as a good opportunity for long-term capital deployment.
We always appreciate the opportunity to interact with our investors directly and you can submit questions regarding the Trust at any time via:
shareholder_questions@bellevuehealthcaretrust.com
As ever, we will endeavour to respond in a timely fashion and we thank you for your continued support during these volatile months.
Paul Major and Brett Darke